Course · Part 5 · Assignment 35
Apply 
Guided Brief: Create an Infographic
Digitise the Infographic
![]() Time limit: 4 hours
Time limit: 4 hours
Remember to use your visual timer! We recommend the inventor’s iOS and Android apps — just search for “Time Timer” in the app store.
Explanation
In this assignment, you’ll choose a layout from your sketches, and then digitise your design in Figma (or InDesign).
Instructions
Choose the strongest layout from your sketches
First, briefly review your sketches from the previous assignment, and choose the layout that you think meets the brief most effectively.
Set up your document
Create a new Figma or InDesign file, and set up your page margins and grid, as you’ve done in previous assignments.
Digitise your design
As you begin, remind yourself of any detailed requirements from the brief. For example, this brief requires you to use only the fonts DM Sans and/or DM Mono.
Also, remember that you’ll want to name your layers and groups as you go along, and duplicate your design regularly so that you can look back at your progress, and explore different versions.
You have four hours for this assignment. Use your visual timer to plan and structure your work — for example, you could work in one-hour blocks, and get feedback from a friend or colleague after each hour.
Export your final design to PDF
Once you’ve spent four hours on your design, export it to PDF. Don’t worry if it’s not “finished” — the purpose of this assignment is to apply your new knowledge, and to keep making progress.
Review the example solution
Once you’ve completed your work on this assignment, take a few minutes to review the example solution below.
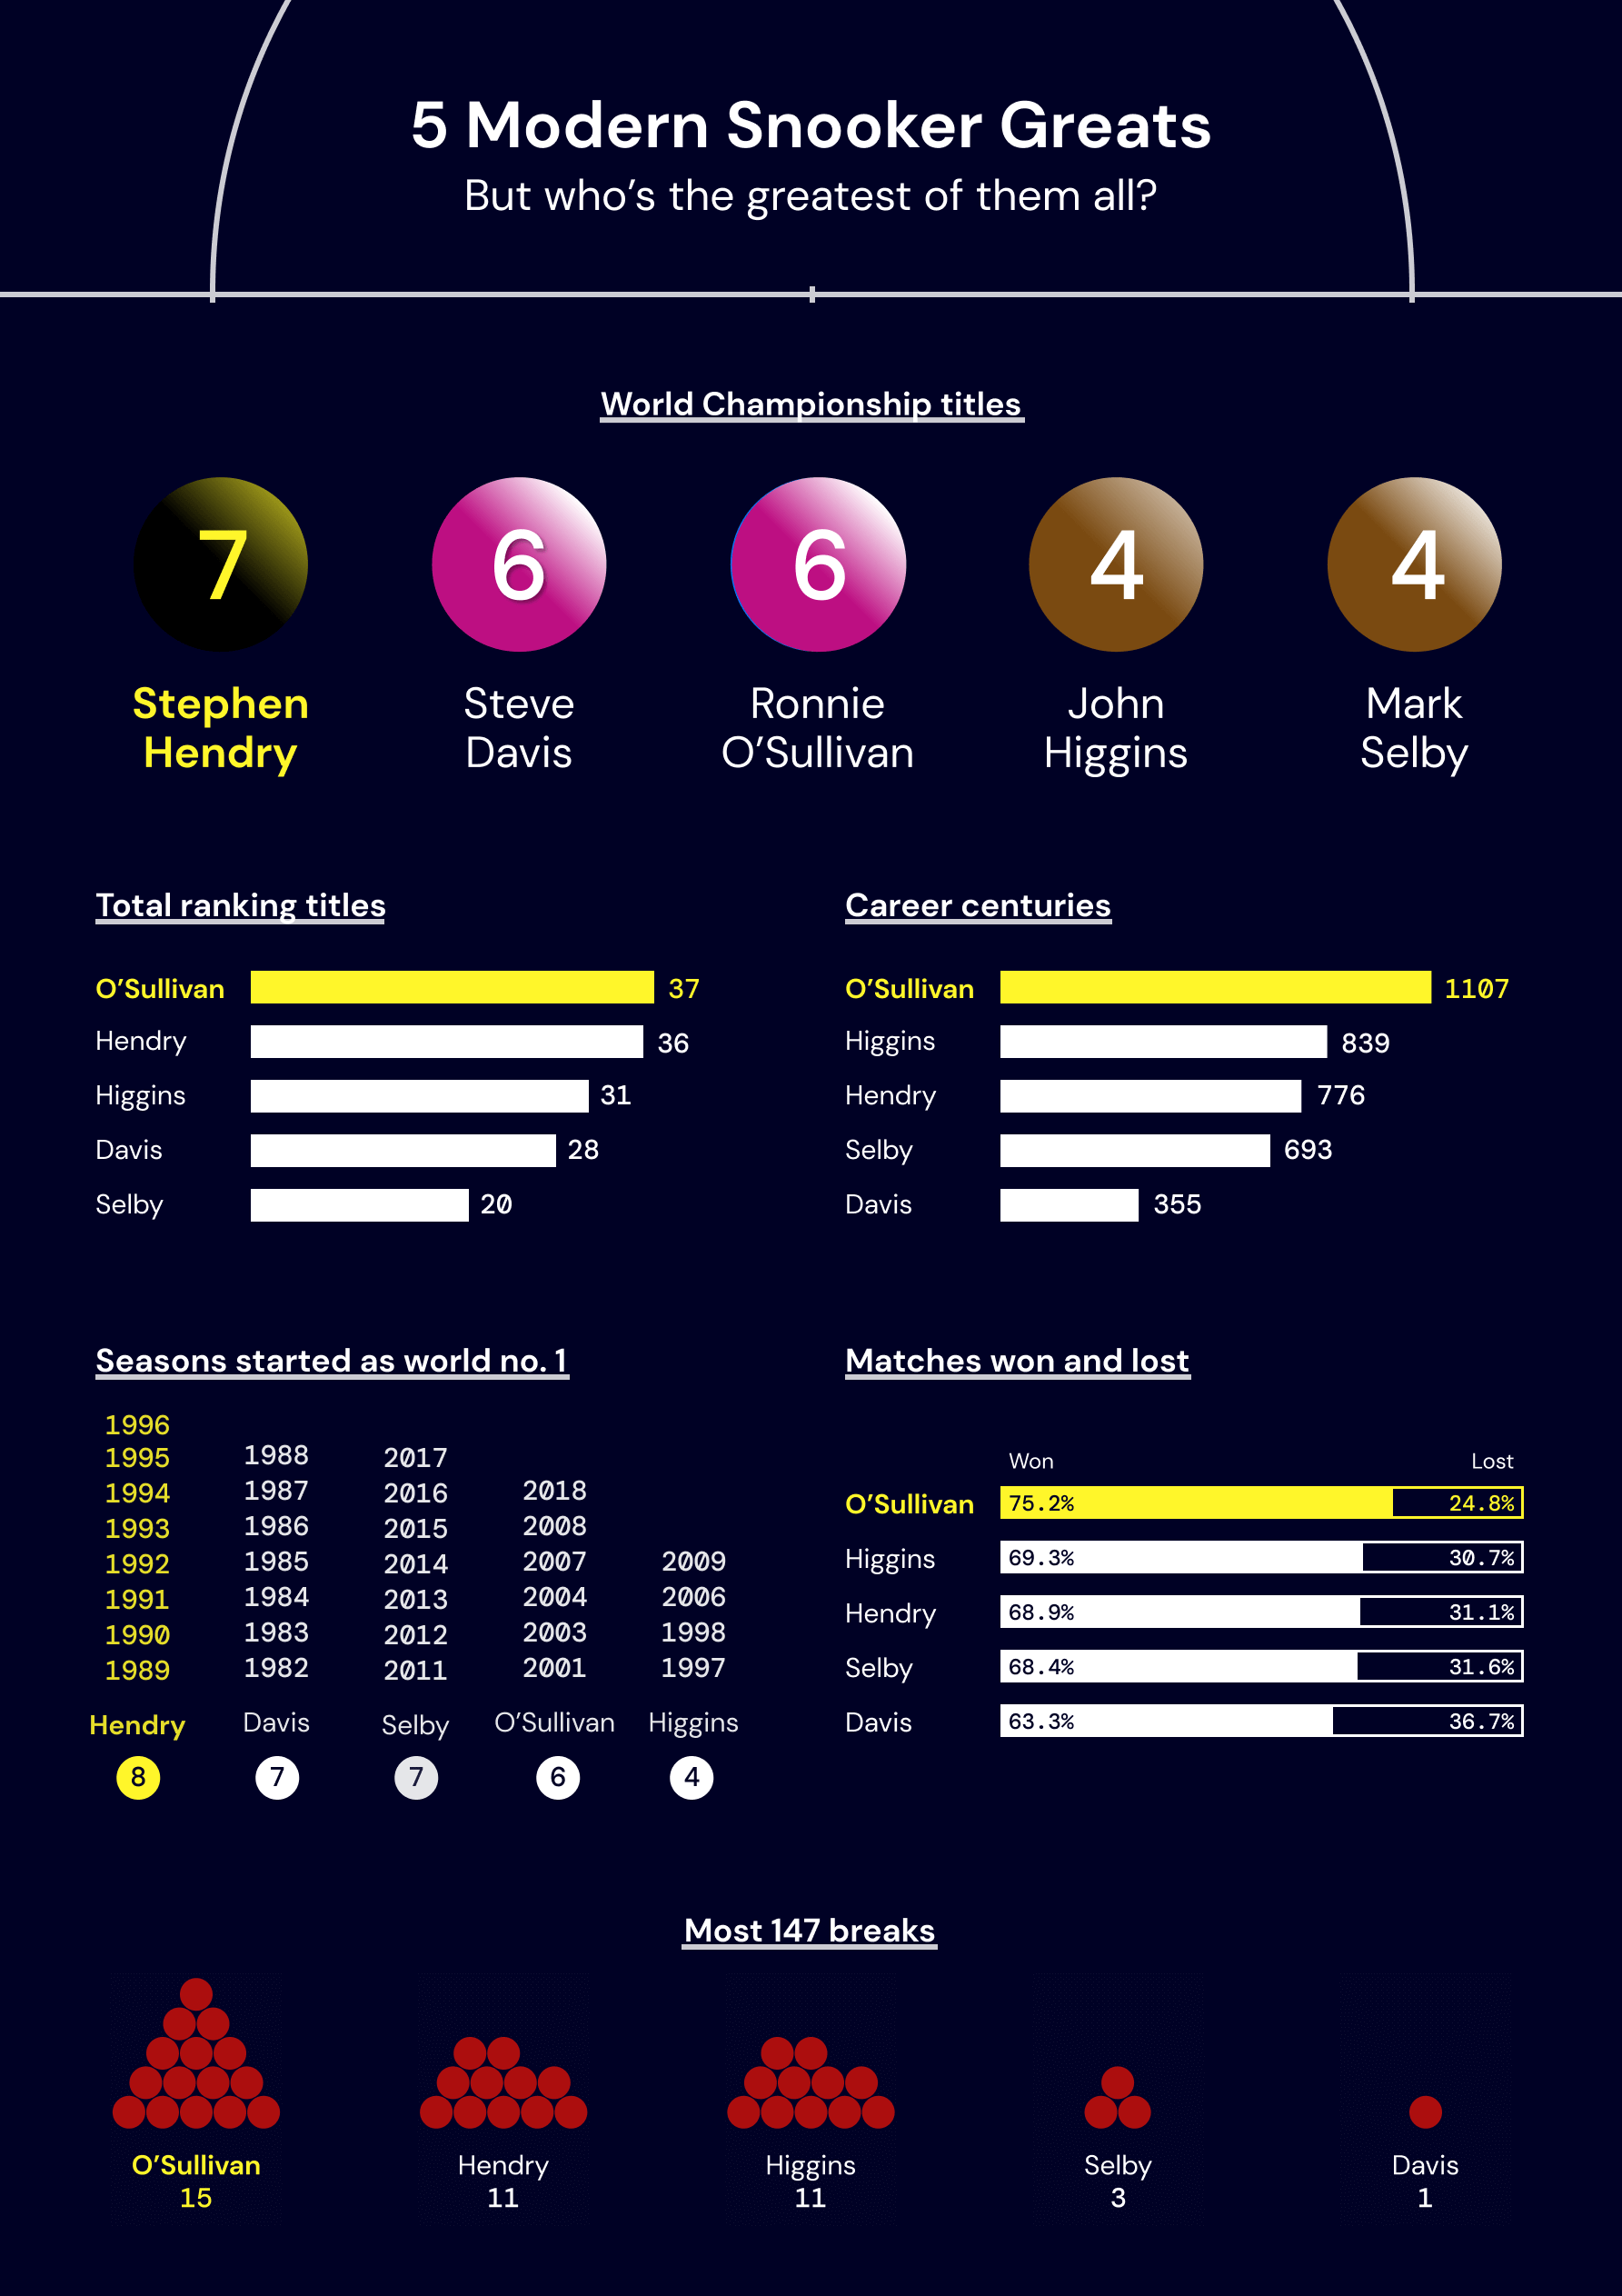
Example solution
We tried to keep our design clean and simple. We kept each chart separate, but added some simple illustrative elements to create a bit of visual interest, and used an accent colour to highlight who was top of the class in each set of data.
In conclusion...
Congratulations! This assignment brings us to the end of Part 5. After you’ve completed the reflection exercise, it’ll be time to move on to some independent portfolio briefs in Part 6.