Course · Part 5 · Assignment 26
Read ![]()
Information Design Basics
KeyThree
The key points from this assignment.
- Information design is about aiding an audience’s understanding of data by presenting it visually — and there is an element of information design in many graphic design and digital design projects
- John Snow’s visualisation of a London cholera outbreak in 1854 shows us the power of information design to generate new insights as well as present existing ones
- Common types of information design include charts, maps, and timelines

Image credit: Baseline Team
Introduction
Although information design is an area of specialisation within the design industry, with professionals who work on information design projects full time, an element of information design is common in most design projects.
In this assignment, we’ll briefly cover the definition and history of information design, and then look through some common types of data visualisation.
What is information design?
There are many definitions of information design available. It’s possible to understand it very broadly, stretching even as far as writing (like this) as a form of information design. However, it’s more common for information design to refer to the design of how information is presented through graphics.
The purpose of information design
Generally, the purpose of information design is to help an audience understand data through visuals, where that data would otherwise just be shown as a set of numbers or a block of text. To simplify, information design is “data made visual”.
While the purpose of information design itself is to help an audience understand data, it’s also, unfortunately, possible for data to be presented in a way that allows an audience to misunderstand it.
This can happen either unintentionally (through errors, or through a poorly designed infographic, for example), or deliberately (when, for example, an organisation might choose a way of visualising data to create a misleading impression about their profit margins).
John Snow’s map of a cholera outbreak (1854)
Many introductions to information design include a number of early examples of information design. These are not only examples of graphics, but also examples of the power of data visualisation to discover and communicate new insights.
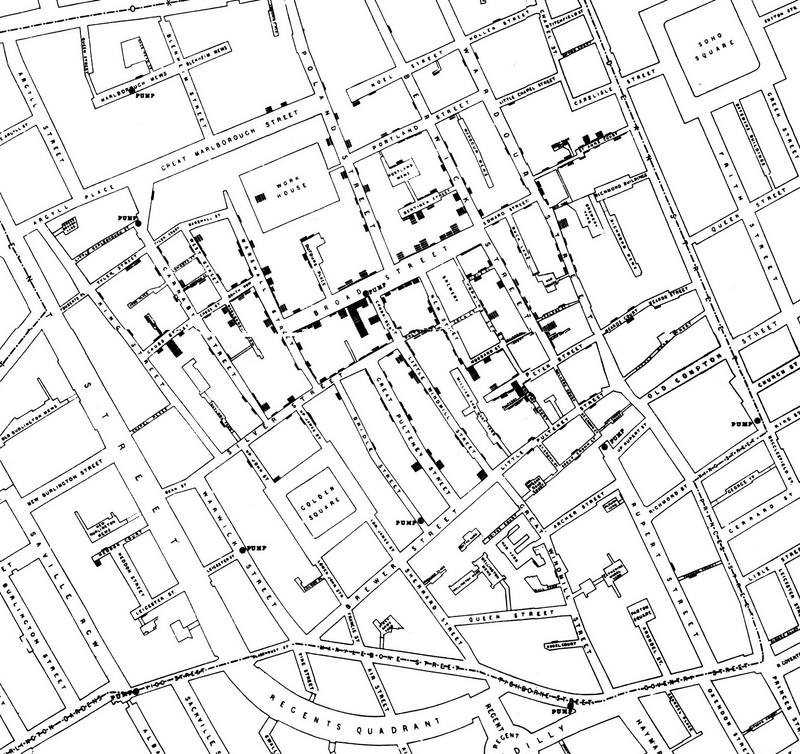
Perhaps the most famous example is John Snow’s map of a cholera outbreak around London’s Broad Street in 1854. At the time, germs and infectious diseases were poorly understood, so such outbreaks were mysterious — being widely blamed at the time on “miasma” in the air.

British physician John Snow (1813–1858). Image credit: Wikimedia Commons
Already suspecting a connection between cholera and water sources, Snow requested official data about the people who had died from cholera in the area. He then plotted the address of each person who had died from cholera on a map.
By doing this, it became clear that cholera deaths seemed to be clustered around the water pump on Broad Street. This led to the insight that the water pump may be the route of disease transmission. Subsequently, he had the handle of the pump removed to interrupt transmission.
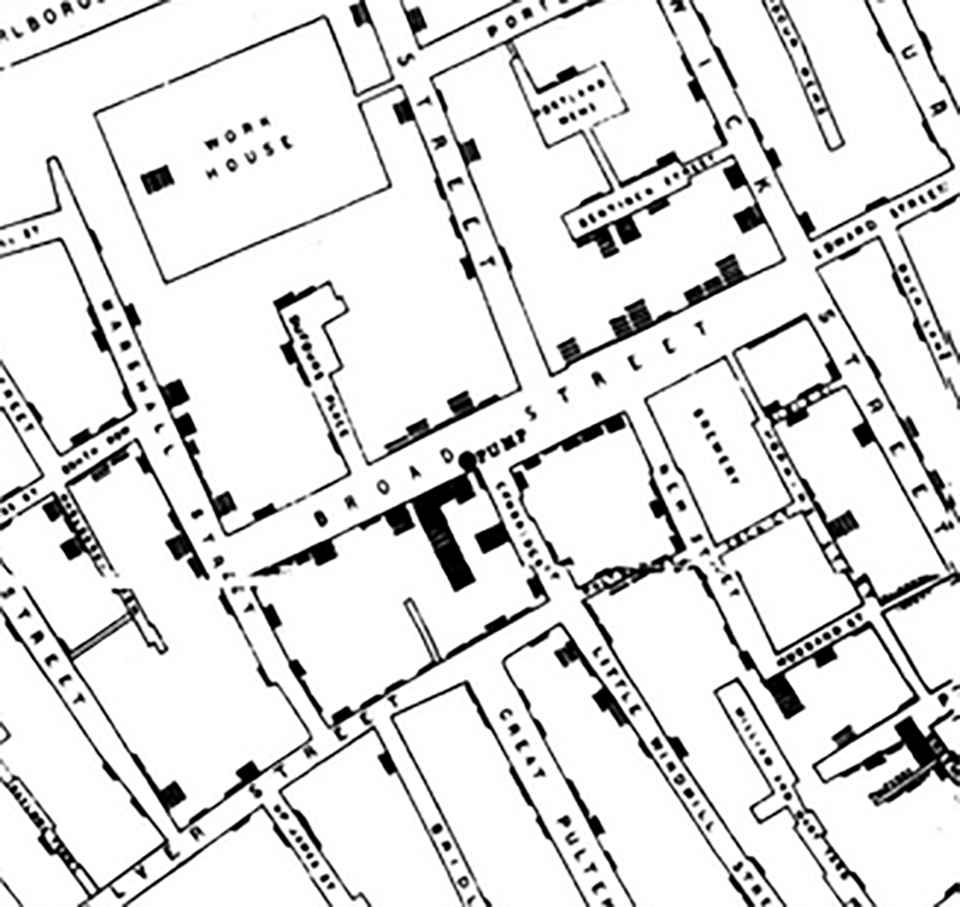
Below is a version of the map that Snow published the following year in an update to his book “On the Mode of Communication of Cholera”. The second image zooms in on the area around Broad Street. He used one solid black bar to indicate one death at an address.
Over the 170 years since Snow’s famous example of information design, our analytical tools and understanding of graphics have developed dramatically.
Nevertheless, in all our projects today, it’s worth remembering three key lessons from Snow’s work:
- Visualising the available data about the outbreak didn’t simply illustrate what was already known. It also allowed for a new insight to be confirmed.
- That insight was discovered because the mode of visualisation Snow chose (a map) allowed existing knowledge (location of deaths) to be connected to something else that had been assumed to be unconnected (the water pump).
- Snow’s innovative presentation of data didn’t only help address this one outbreak; it contributed to the broadening of knowledge about infectious disease more generally.
In short: don’t underestimate the power of information design.
Types of information design
Much information design is essentially choosing and designing charts that best communicate a set of data. There are many types of chart — below, we’ve picked some of the most commonly used ones. Later in Part 5, we’ll look at some more advanced charts and when to use them.
Bar charts and histograms
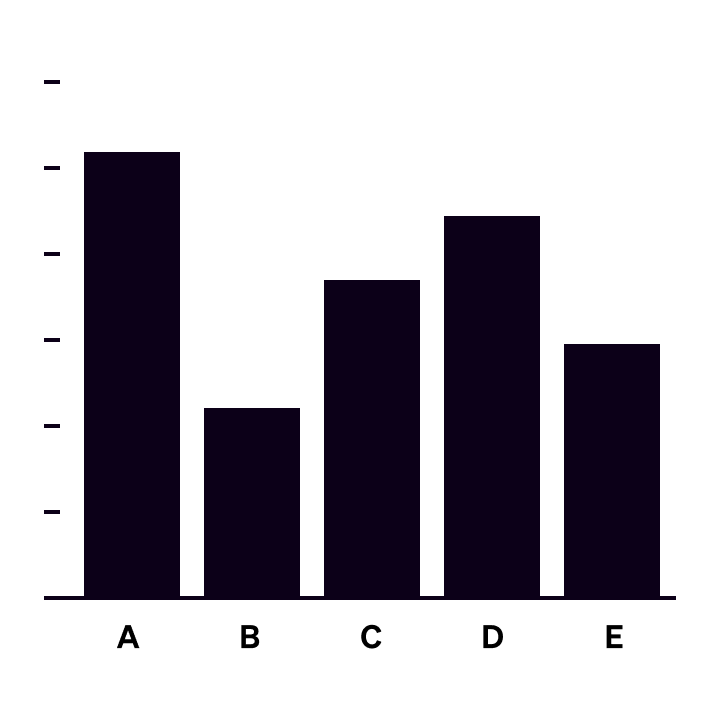
Bar chart (vertical)
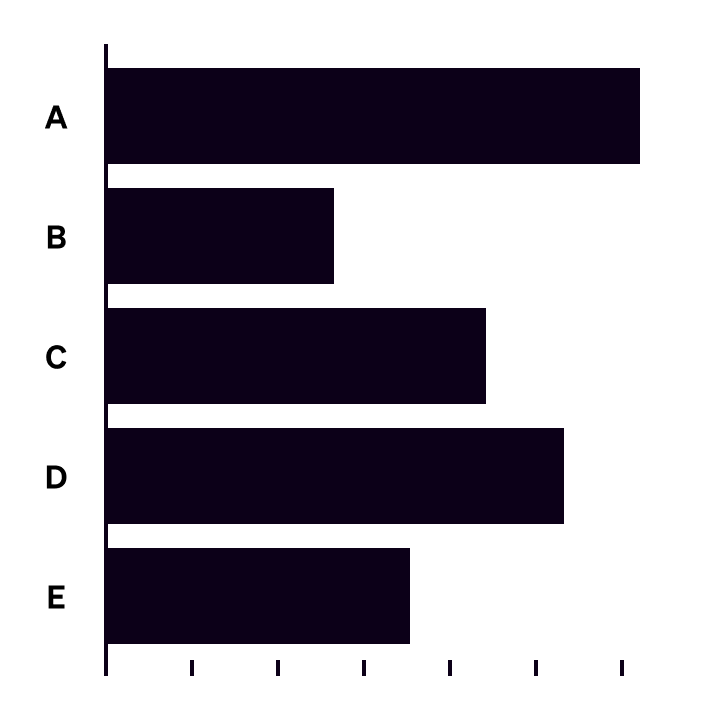
Bar chart (horizontal)
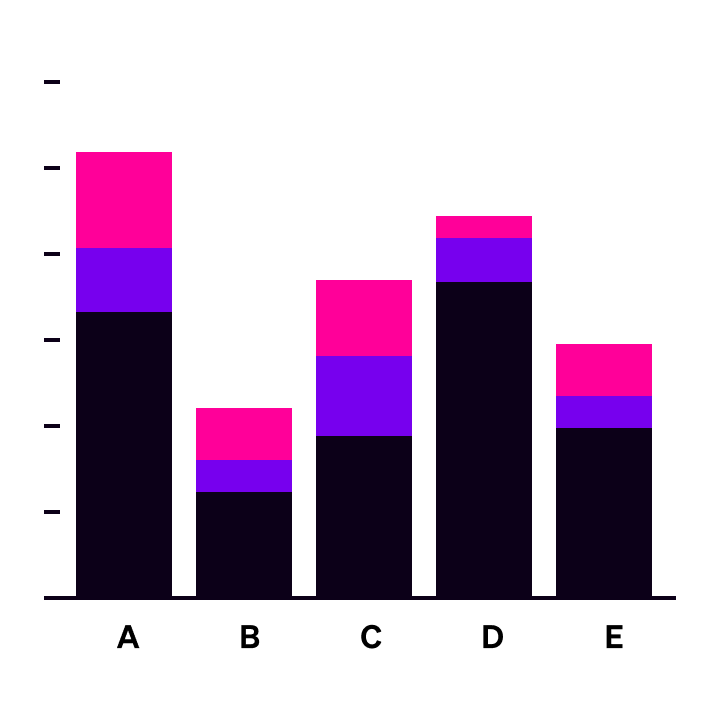
Stacked bar chart (vertical)
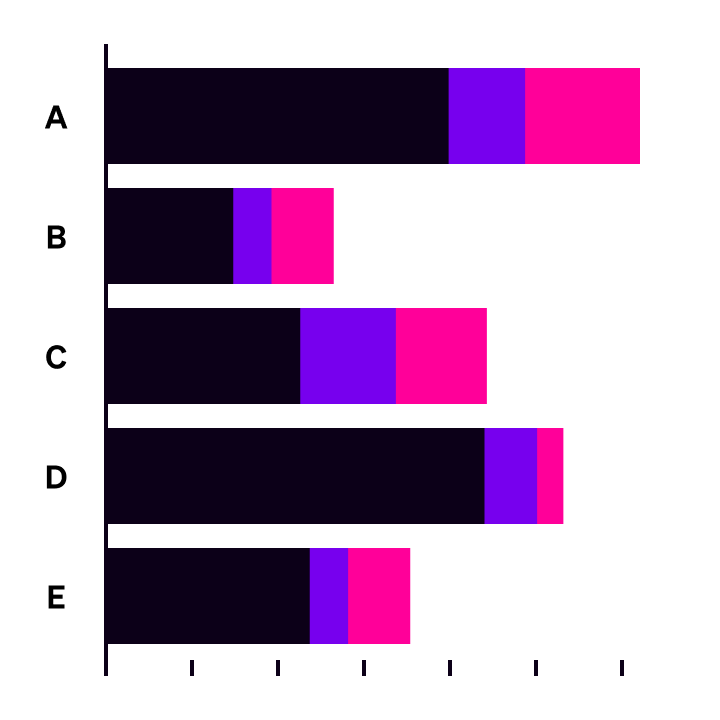
Stacked bar chart (horizontal)
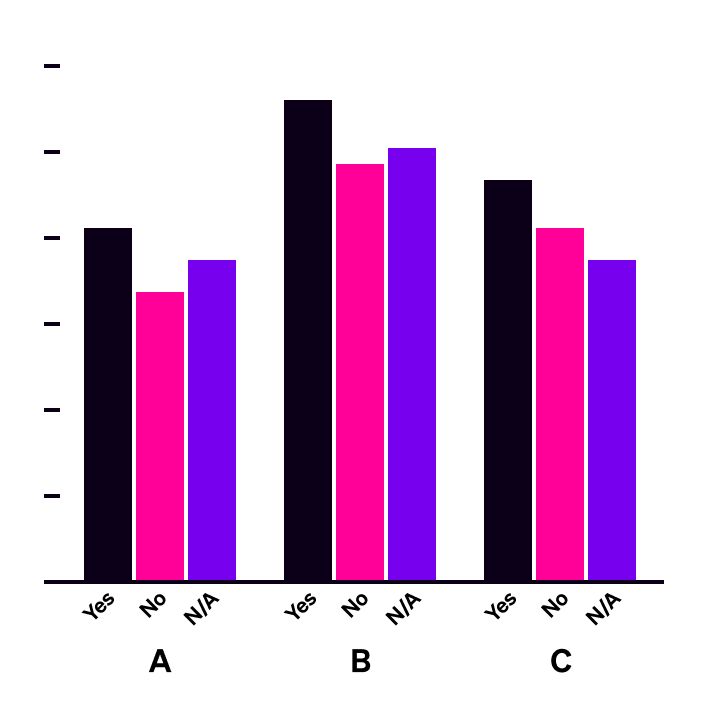
Grouped bar chart (vertical)
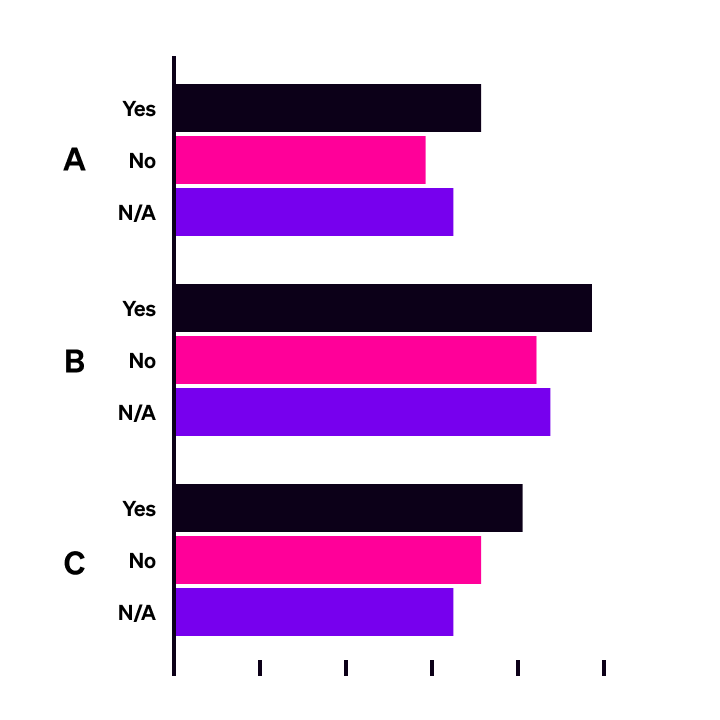
Grouped bar chart (horizontal)
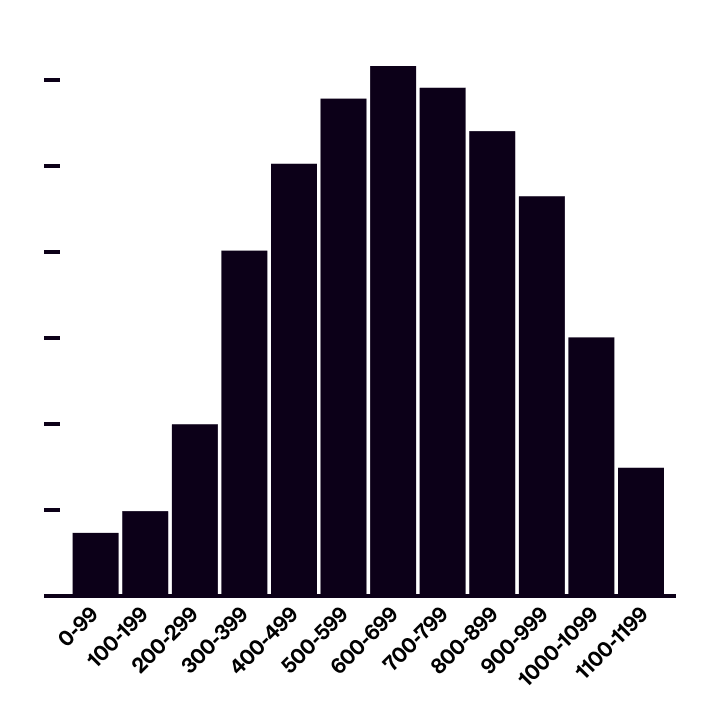
Histogram
Line and scatter charts
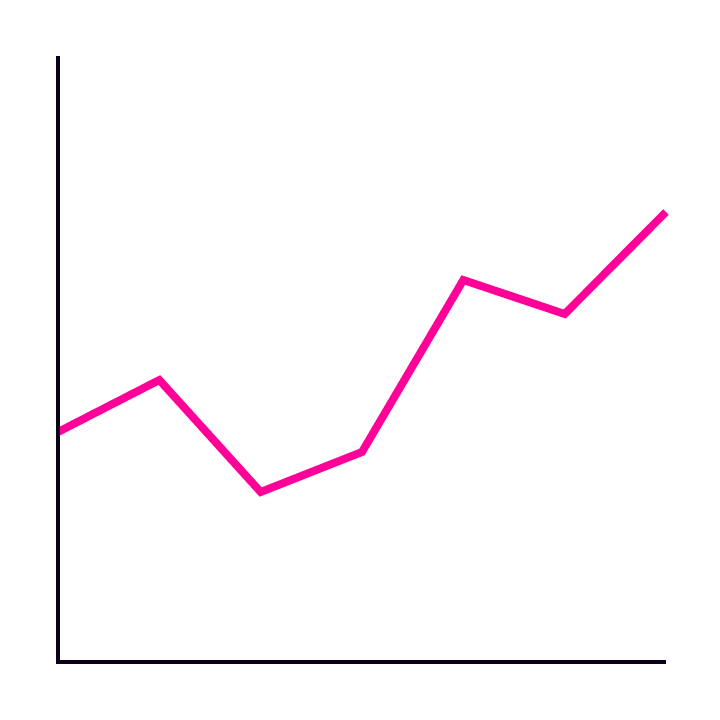
Line chart
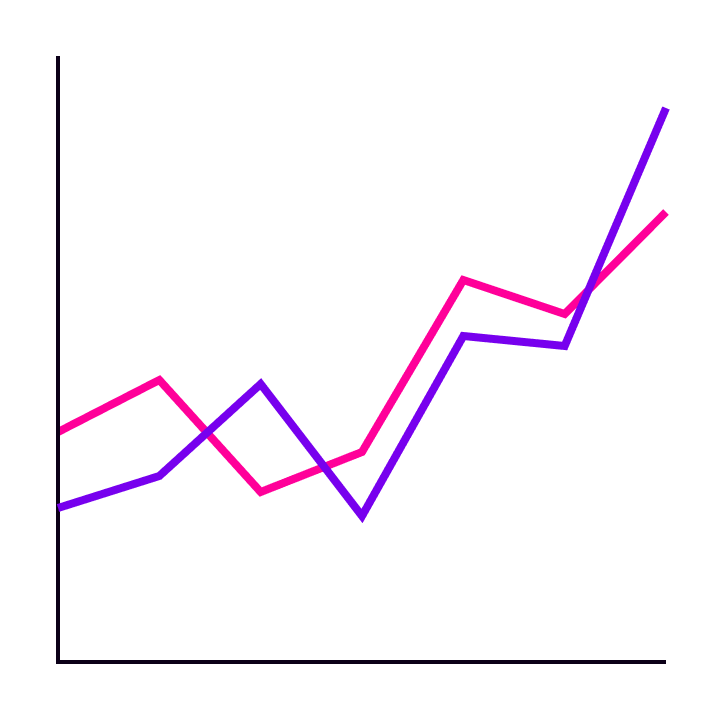
Multi-line chart
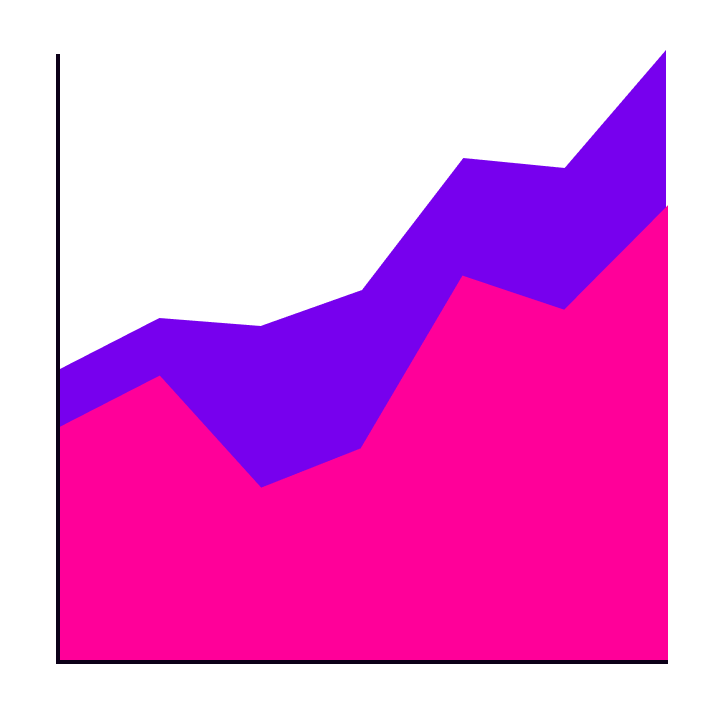
Stacked line chart (area chart)
Scatter chart
Scatter chart with line of best fit (trendline)
Pie charts and donut charts
Pie chart
Nested pie chart
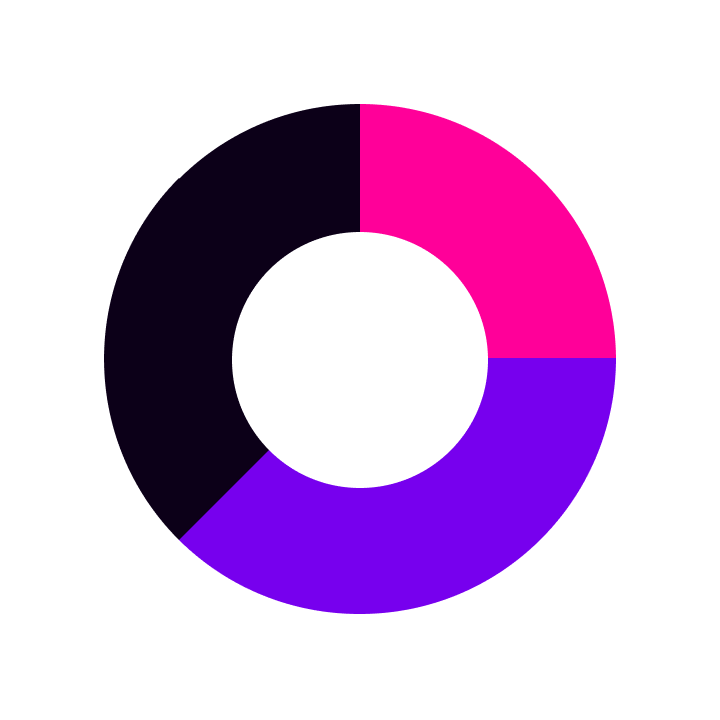
Donut chart
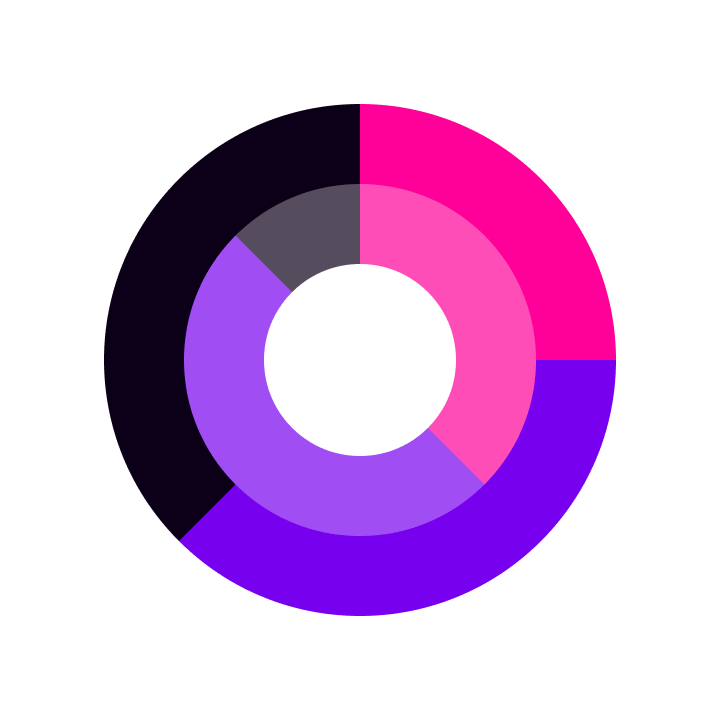
Nested donut chart
Flow and tree charts
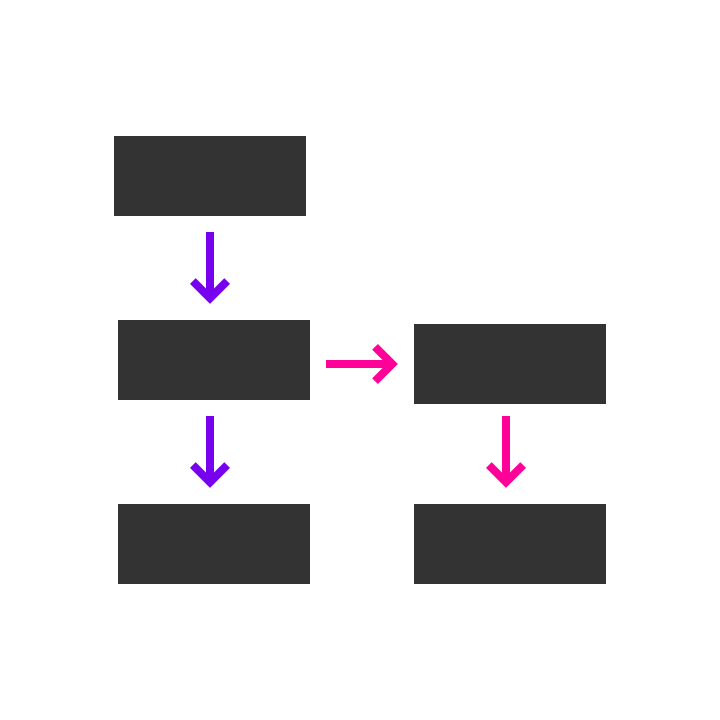
Flow chart

Linear process chart
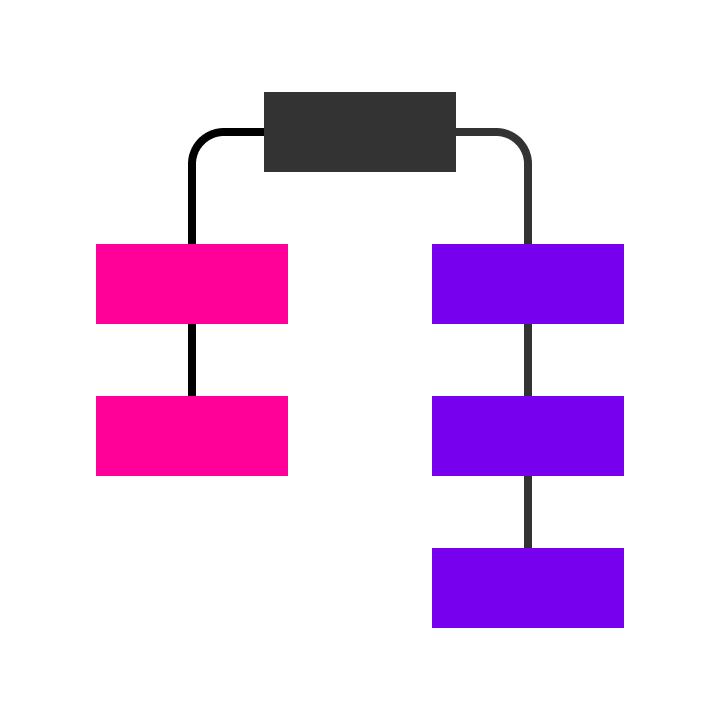
Tree chart
Maps
Line chart
Multi-line chart
Stacked line chart (area chart)
Scatter chart
Scatter chart with line of best fit (trendline)
Pie chart
Nested pie chart
Donut chart
Nested donut chart
Flow chart
Linear process chart
Tree chart
Maps can be very literal, simply showing a scaled down drawing of geographical space, or more abstracted. Here are some common types of map used in information design:
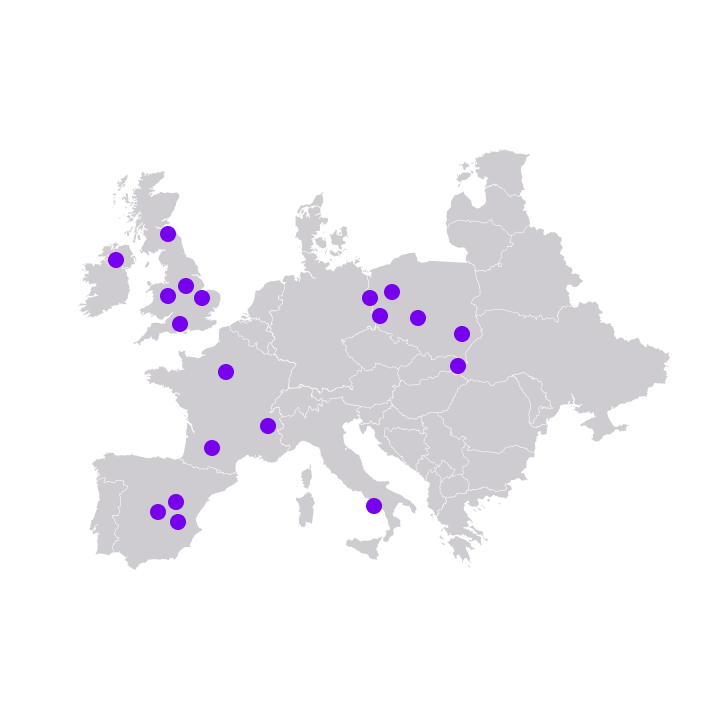
Dot map
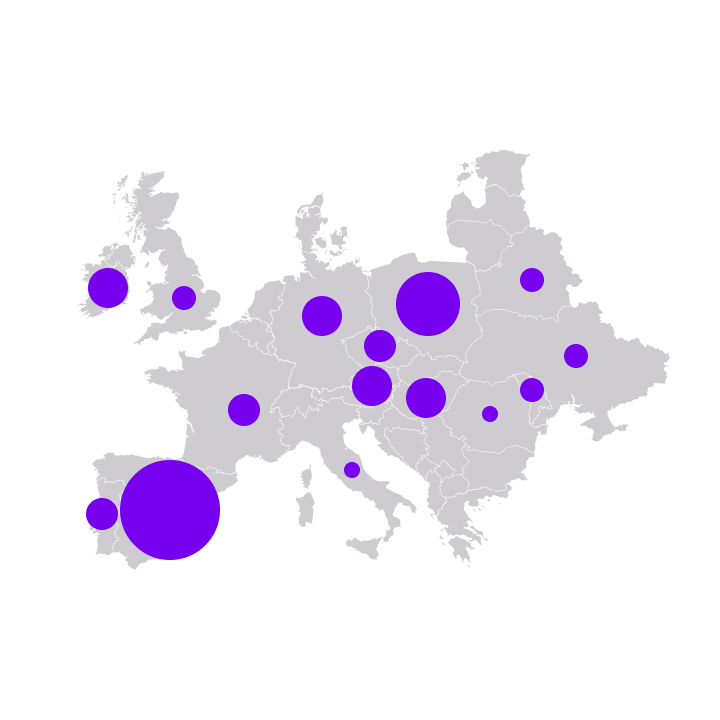
Bubble map
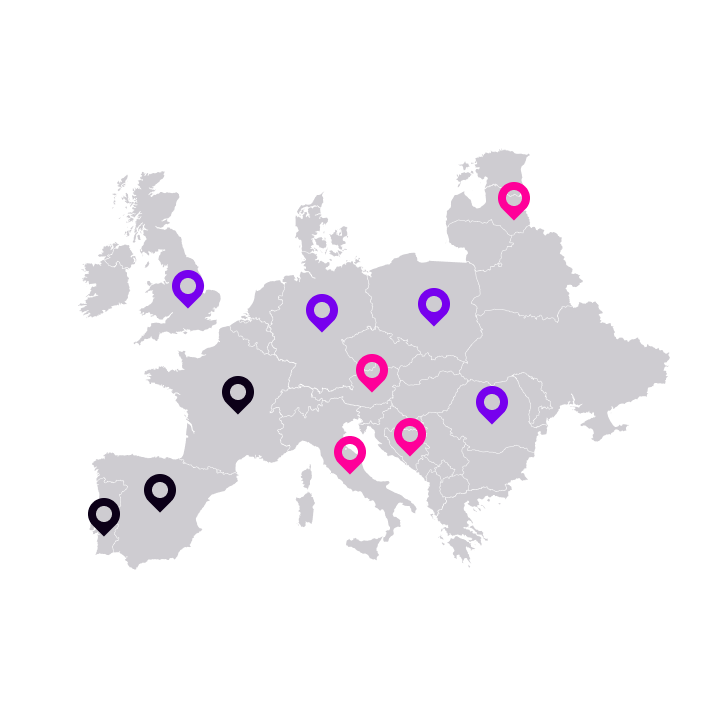
Pin map
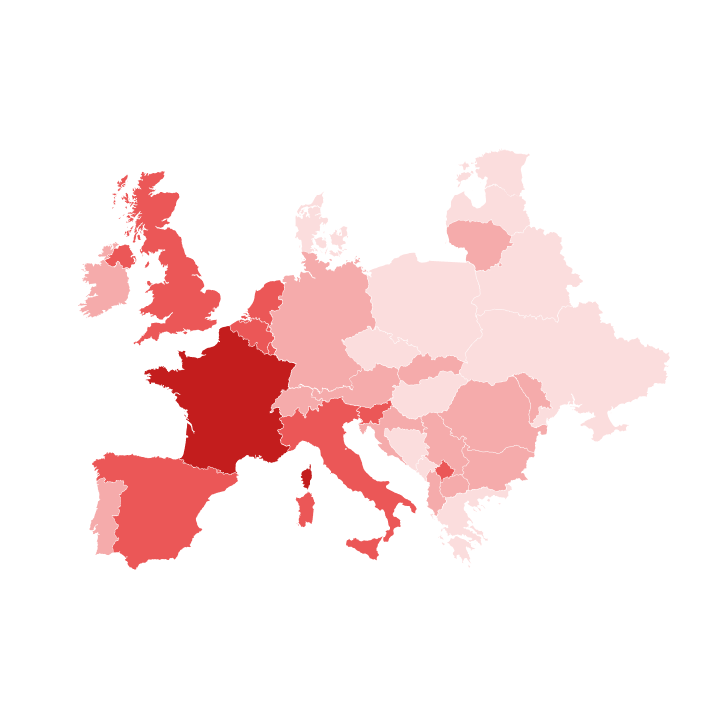
Heat map (Choropleth map)
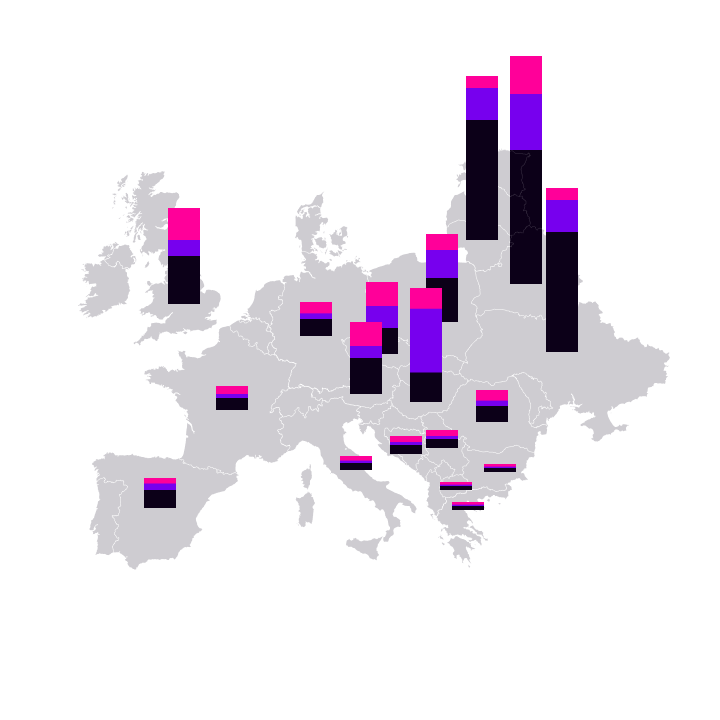
Map with bar chart
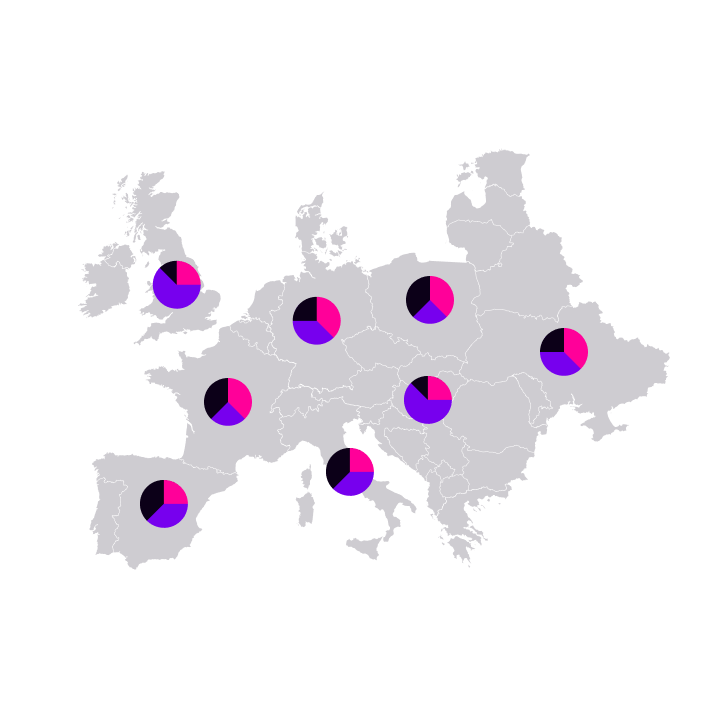
Map with pie chart
Other charts
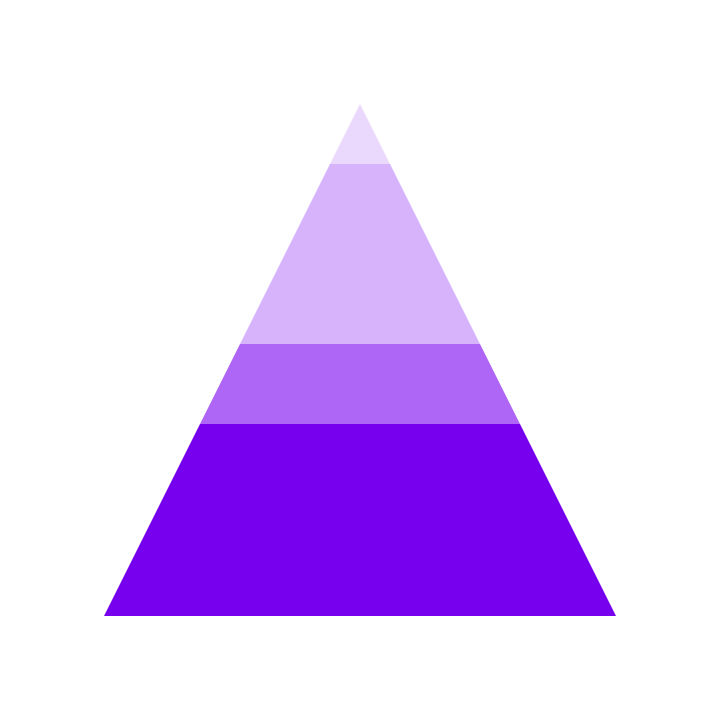
Pyramid chart

Funnel chart
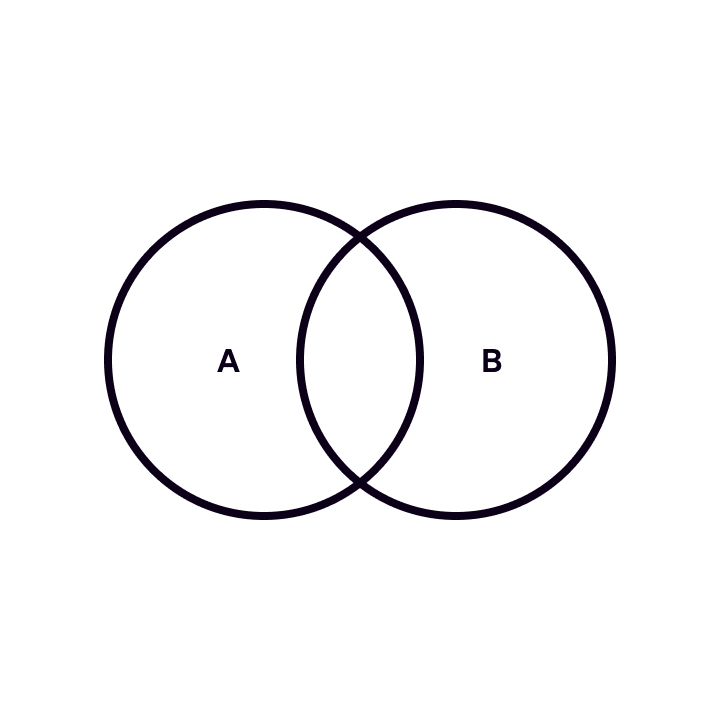
Venn diagram
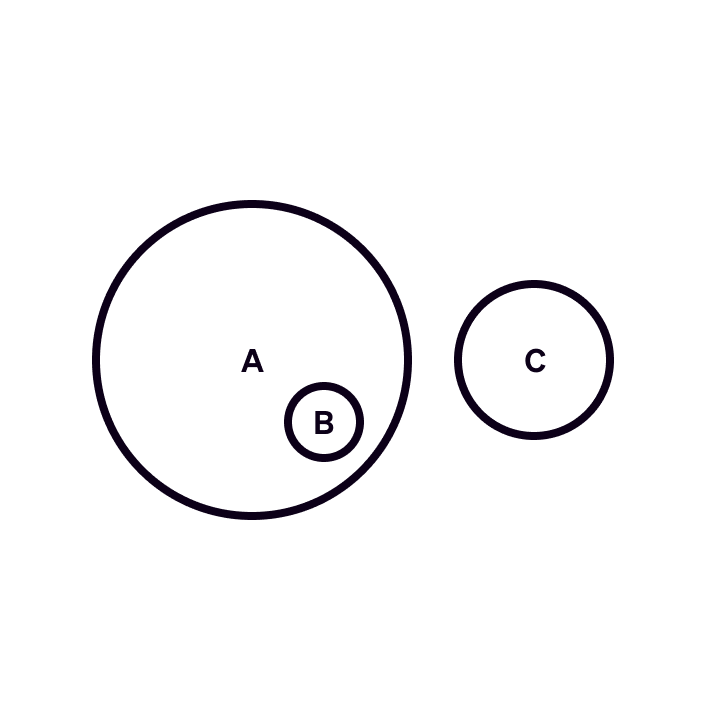
Euler diagram
In conclusion...
Data visualisation is one of the designer’s most powerful communication tools, and for that reason it needs to be used carefully and responsibly.
In the next two assignments, we’ll first look at how to use data visualisation well — and then at how information design can go wrong.